What are Data Visualization tools in IoT?
Advanced visualization tools graphically present data in IoT, making data visualization a simple yet powerful way to interpret complex information.
Systems typically convert raw data collected by gadgets into engaging visuals like dashboards, graphs, and charts. These graphics help users in better understanding the ongoing data trends and patterns for eventually forming insights.
IoT-powered apps use data visualization to enable better analysis and improve decision-making processes. Moreover, by crawling through real-time information, data visualization helps businesses track performance, streamline operations, and accurately forecast maintenance needs. In addition, through such an immersive channel of representation, users can easily detect anomalies and, consequently, implement corrective strategies on the go. As a result, businesses become more agile and responsive to operational challenges.
Key Features of Data Visualization Tools in 2025 for IoT Apps
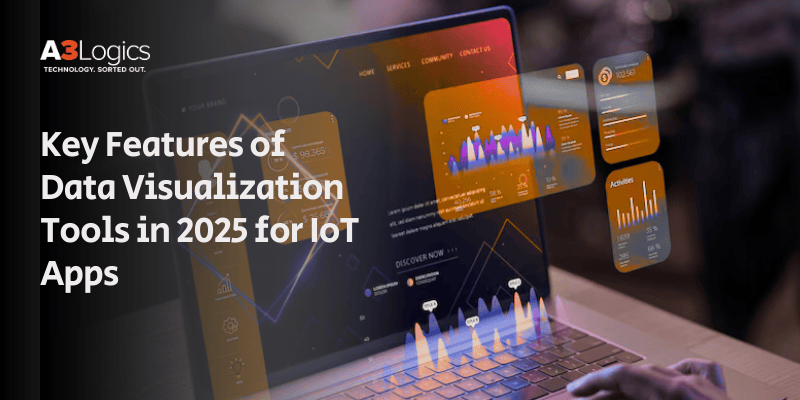
In 2025, IoT data visualization tools for applications will become more user-friendly and powerful than ever. These tools are predicted to showcase advanced features that will enhance decision-making and operational output in real-time. Here are some of the key features that we can expect from the tools in 2025:
- Real-Time Information Processing: Tools will open a window for the real-time streaming of information from several IoT gadgets.
- Data-driven Analytics: ML (machine learning) and AI (artificial intelligence) integration will provide insights and anomaly detection.
- Dynamic Dashboards: Highly personalized dashboards will allow users to deep-dive into information and communicate with it.
- Cloud-Enabled Integration: Flawless integration with cloud-based platforms for seamless data access, scalability, and storage.
- Multi-Gadget Support: IoT visualization tools will also promote cross-functionality among platforms and devices for instant access.
- Interactive Layout: Intuitive interfaces will showcase drag-and-drop features for creating attractive visualizations.
- Information Security: Robust security features will safeguard critical IoT data and ensure regulatory compliance with standards.
- Teamwork Capabilities: Tools will also help professionals to collaborate and share visualizations in real-time.
- Personalized Alerts: Users can schedule notifications depending on preset benchmarks or irregularities in IoT information.
- Big Data Integration: These tools will also provide support for handling large databases across diverse environments.
As the field of IoT grows in complexity, IoT visualization tools are set to become significant in pulling out unique insights and making data-backed decisions.
Top IoT Data Visualisation Tools of 2025 with Key Features
In 2025, the world will see a remarkable shift in the way businesses and organizations from different corners of the world welcome the efficiency of data visualization tools. These advanced tools are all set to reshape how huge chunks of complicated data can be turned into easy-to-understand graphics. Moreover, the benefits of data visualization tools will include overall business efficiency with the help of analysis that’s pulled off in real-time.
1. Tableau
Tableau is one of the most popular IoT data visualization tools commonly used in IoT apps. Notably, it excels at transforming large volumes of data into visually interactive dashboards. Moreover, it’s a top choice among IT professionals due to its powerful analytics capabilities. In particular, its ability to support real-time data collection and processing makes it highly compatible with IoT environments.
Core Features:
- Easy Drag-and-Drop UI
- Real-time notifications
- Advanced security protocols
- Attractive dashboards
- AI-fuelled insights
- Integration with Cloud Platforms
2. Power BI
Power BI, Microsoft’s flagship business analytics tool, is widely recognized for its seamless integration with IoT data sources. Additionally, it provides real-time insights, which makes it one of the most sought-after IoT visualization tools available today. Its user-friendly interface and robust analytics further enhance its appeal across industries.
Core Features:
- Live Information streaming
- Seamless connectivity with Microsoft solutions
- Responsive, Personalized dashboards
- AI-fueled Predictive analytics
- Advanced security protocols
- Shared Workspace tools
- Supports third-party integrations
Also read: Power BI vs. Tableau
3. Grafana
It is an open-source framework developed for visualizing time-series information. It’s a great tool for monitoring data and offers detailed personalization and versatility for real-time visualizations.
Core Features:
- Real-time alerting and monitoring
- Highly Personalized Dashboards
- Integrates with diverse IoT Data Inputs
- User-friendly Design
- Community-Powered Open-Source plugins
- Seamless Connectivity across Local and Cloud systems
4. Kibana
Kibana is known among the most compelling IoT visualisation tools used for time-series and log analysis. It’s Elasticsearch-friendly, which makes it perfect for IoT network monitoring and security apps.
Core Features:
- Elasticsearch-powered for Big Data management
- Innovative Data Alerts and Monitoring
- Options for Advanced Search and Personalization
- Customizable Dashboards
- Detailed Analytics and Proactive Query Responses
- Graphic display of complex IoT Data
5. Google Data Studio
It’s not possible to speak of the best data visualization tools and not mention Google Data Studio. It’s extremely popular among IoT experts because of capabilities that welcome easy integration with Google Cloud Services. It helps users generate engaging reports with unique graphics from a variety of information sources. The fact that it’s free of cost makes it one of the best IoT app visualization tools.
Core Features:
- Cloud-based Free Platform
- Effortless integration with Google services and IoT sources
- Flexible, and User-responsive dashboards
- Constant Data updates
- Effortless Click-and-Place Design
- Shared Workspace Functionality
- Instant and Automatic System updates
6. ThinkSpeak

ThingSpeak is an IoT analytics tool that excels in collecting, processing, and visualizing data from IoT frameworks. Moreover, this open-source platform—written in Ruby—serves as a bridge between users, IoT applications, and data visualization. Its flexibility and compatibility make it a reliable choice for developers working on custom IoT solutions.
Core Features:
- IoT gadgets & sensors Friendly
- Gathers information in real time
- Integrated with MATLAB for advanced processing
- Data Sharing via Open and Controlled models
- 3rd Party integrations through APIs
- Infrastructure can be hosted on the cloud
7. D3.js
D3.js is yet another tool that’s worth mentioning in the list of the best IoT data visualization tools. It’s a brilliant JavaScript library for users who want to create interactive and dynamic data visualizations. It can be leveraged for several IoT apps for creating personalized charts, graphs, and dashboards.
Core Features:
- Dynamic and Engaging Visual Displays
- Multi-format Functionality
- Live IoT Data Connectivity
- Data-fueled animations and transformations
- Publicly Available Repository
- Highly Effective for Advanced Visualizations
8. Chart.js
Chart.js is an easy-to-use and simple JavaScript repository for those who want to create eye-catching graphs and charts. It ranks among the top IoT visualisation tools and is used in IoT apps for visually representing time-series information.
Core Features:
- Low-resource utilizing and Easy-to-use
- Offers Various Chart Options (Bar, Line, and Radar)
- Continuous Data Synchronization
- Hassle-Free Connectivity with Web Apps
- Responsive and Engaging Data Charts
- Free-to-Use Community Platform
9. Qlik Sense
Qlik Sense is an insight-driven data visualization framework that assists IoT users in analyzing and processing data. The best part about Qlik Sense is its model which works on associative information and features superfine analytical capabilities.
Core Features:
- Information Processing and Real Time Visualization
- Framework that supports useful Insights
- User-friendly drag-and-drop UI
- Personalized Dashboards
- Compatible with a wide range of IoT gadgets
- ML-powered Tools that promote advanced Analytics
Future Trends in IoT Visualisation
Data visualization for IoT apps has turned around how business used to deal with everyday issues at the workplace. The future looks nothing short of promising for how things will move from here onwards. That being said, Let’s dive into some of the trends that will be reshaping the future of IoT visualization in 2025 and beyond:
- AI-fueled Insights: IoT devices will make use of AI technology to enable the forecasting of trends before anyone could notice.
- AR (Augmented Reality): AR will offer several ways to visually represent IoT-powered information in real-time, particularly for complex systems.
- Edge Computing: Visualization tools will also resituate next to the data origin with the help of edge computing, to locally process information, minimizing latency.
- Advanced Security Protocols: As Data visualisation for IoT apps progresses, tools will require powerful safety features to safeguard information from breaches.
- Sophisticated Decision Making: With ML (Machine Learning), IoT tools will make decisions automatically via data insights, like resource optimization or predictive maintenance.
- Impact of 5G: The rollout of the 5G network will promote rapid transfer of data, ensuring high-quality data visualizations.
- NLP (Natural Language Processing): Innovative NLP tools will allow users to communicate with IoT frameworks via text or voice or commands, making it easier to navigate through huge datasets.
How A3Logics Can Be Your Partner in Building Data Visualisation Tools for IoT
With comprehensive experience in developing IoT app visualization tools, A3Logics can offer custom visualizations that meet the needs of your business.
Our outstanding team of experts holds years of experience in pulling off integrations of several IoT-based frameworks. We ensure that our clients enjoy the benefits of effortless data processing and streaming in real time. Our core focus lies in developing attractive and user-friendly Power BI dashboards that not just produce insights, but also help in making smart and effective strategies for growth. A3Logics is known for utilizing ML (Machine Learning) and AI (Artificial Intelligence), to improve predictive features, which is an add on to the customized capabilities.
We believe in working shoulder-to-shoulder with our clients to know about their pain points, so that we can build a product that boosts overall business efficiency. From basic tools that monitor sensor data to full-scale complex systems meant for big data processing, we hold expansive knowledge of Data visualisation for IoT apps.
In today’s rapidly evolving tech landscape, A3Logics delivers personalized IoT development services that ensure real-time insights, seamless integration, and high-performing applications. Furthermore, with our deep expertise, your business can stay ahead of the competition, optimize operations, and extract valuable insights from IoT data—ultimately driving greater profitability.
We are living in times when everything is changing on a constant basis, and growing a business demands a lot more than consistency. A3Logics holds a reputation for offering tailor-made solutions that help good business become great, by pulling useful insights from IoT frameworks to multifold profitability.
Conclusion: Data Visualization Tools for IoT
Data visualization plays a critical role in realizing the true potential of IoT apps. As these modern devices continue generating huge volumes of information, visualization tools are assisting businesses with the effective interpretation of big data.
The future has already set the stage for IoT data visualization. In the years to come, businesses from different corners of the world will witness its power through unique real-time insights, AI-powered analytics, and personalized dashboards. Inter-departmental functioning and cloud-based models will help business experts strike profitable deals.
Some of the best tools predicted to top the charts in 2025 include Power BI, Tableau, and Grafana—each offering distinct features tailored to dynamic IoT needs. Not only do these tools generate compelling visual charts, but they also deliver unique insights that can significantly boost business growth. Furthermore, as the IoT domain continues to expand, the demand for efficient data visualization will rise accordingly.
Therefore, partnering with an IoT app development company ensures better representation of your existing data. In turn, this improved data representation leads to more informed decisions and, ultimately, accelerated business growth.